Cluster Downscale
Here are the results obtained by kube-green in a cluster of 75 namespaces, with kube-green enabled in 48 namespaces with pods in sleep during non-working hours.
The configuration used is to wake up during working hours:
apiVersion: kube-green.com/v1alpha1
kind: SleepInfo
metadata:
  name: working-hours
spec:
  weekdays: "1-5"
  sleepAt: "20:00"
  wakeUpAt: "08:00"
  timeZone: "Europe/Rome"
  suspendCronJobs: true
  excludeRef:
    - apiVersion: "apps/v1"
      kind:       Deployment
      name:       api-gateway
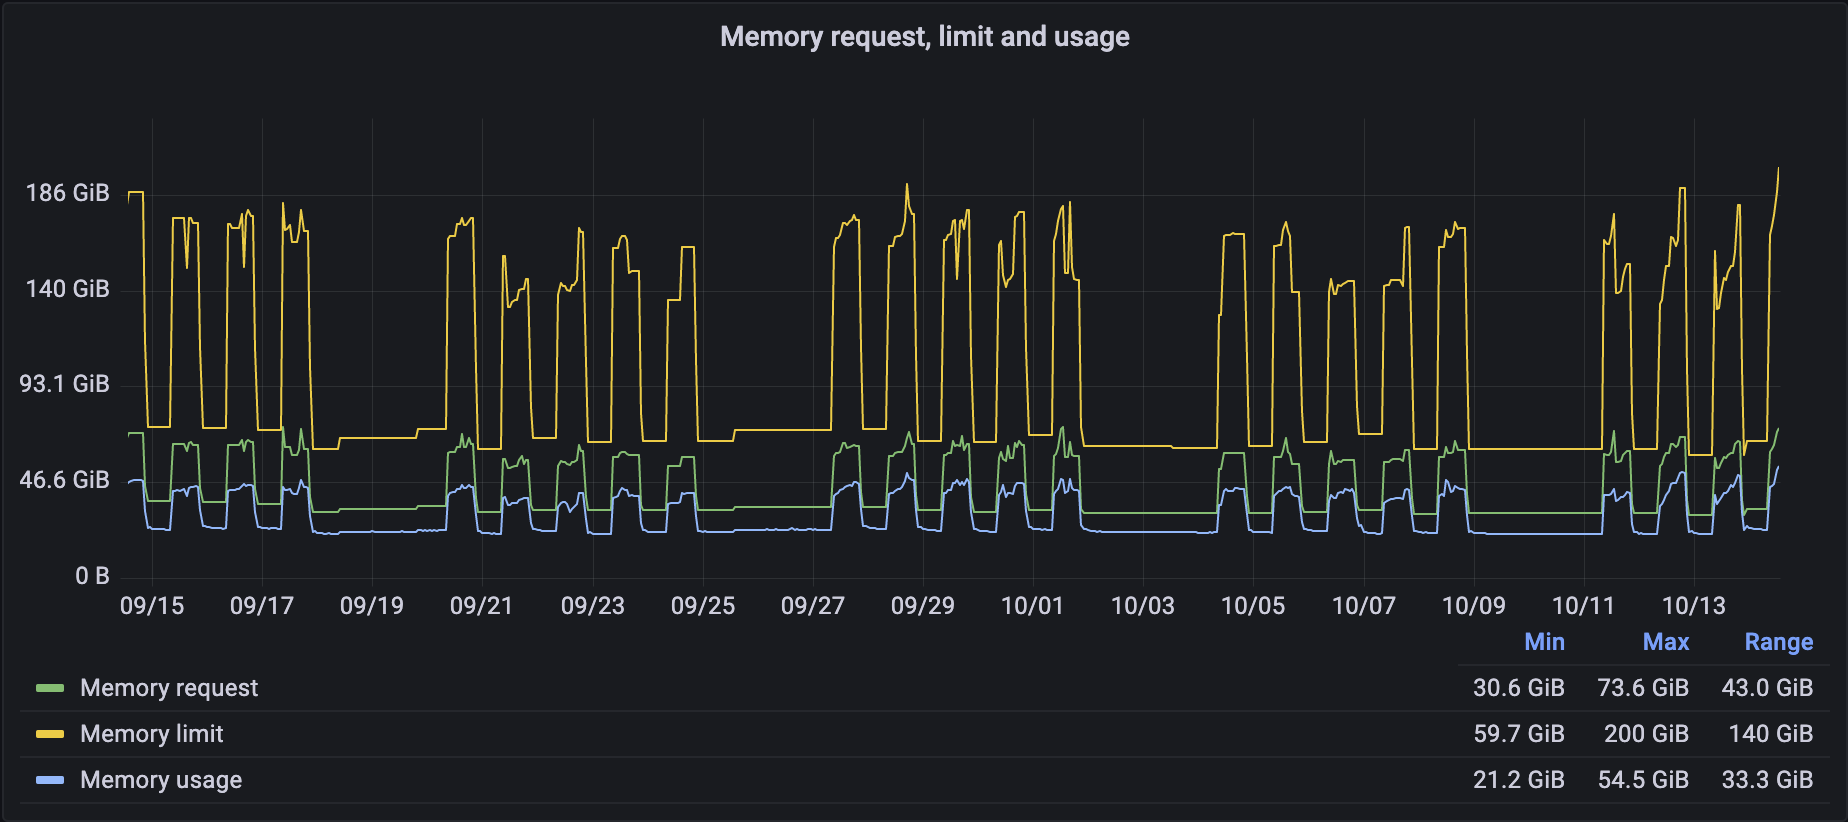
In the following images, there are 3 lines representing request, limit and usage for memory and CPU.
Request is the amount of resource allocated (reserved by pod) in the cluster. Limit is the amount of resource allowed to be used by the pod in the cluster. Usage is the amount of resource actually used by the pod in the cluster. This is the real consumption of the pod.
Memory Usage
In this image, it is possible to see the memory usage of the cluster.
It is possible to see the memory lines with 5 peaks during the working day, and a low usage and allocation of memory during the nights and weekends.
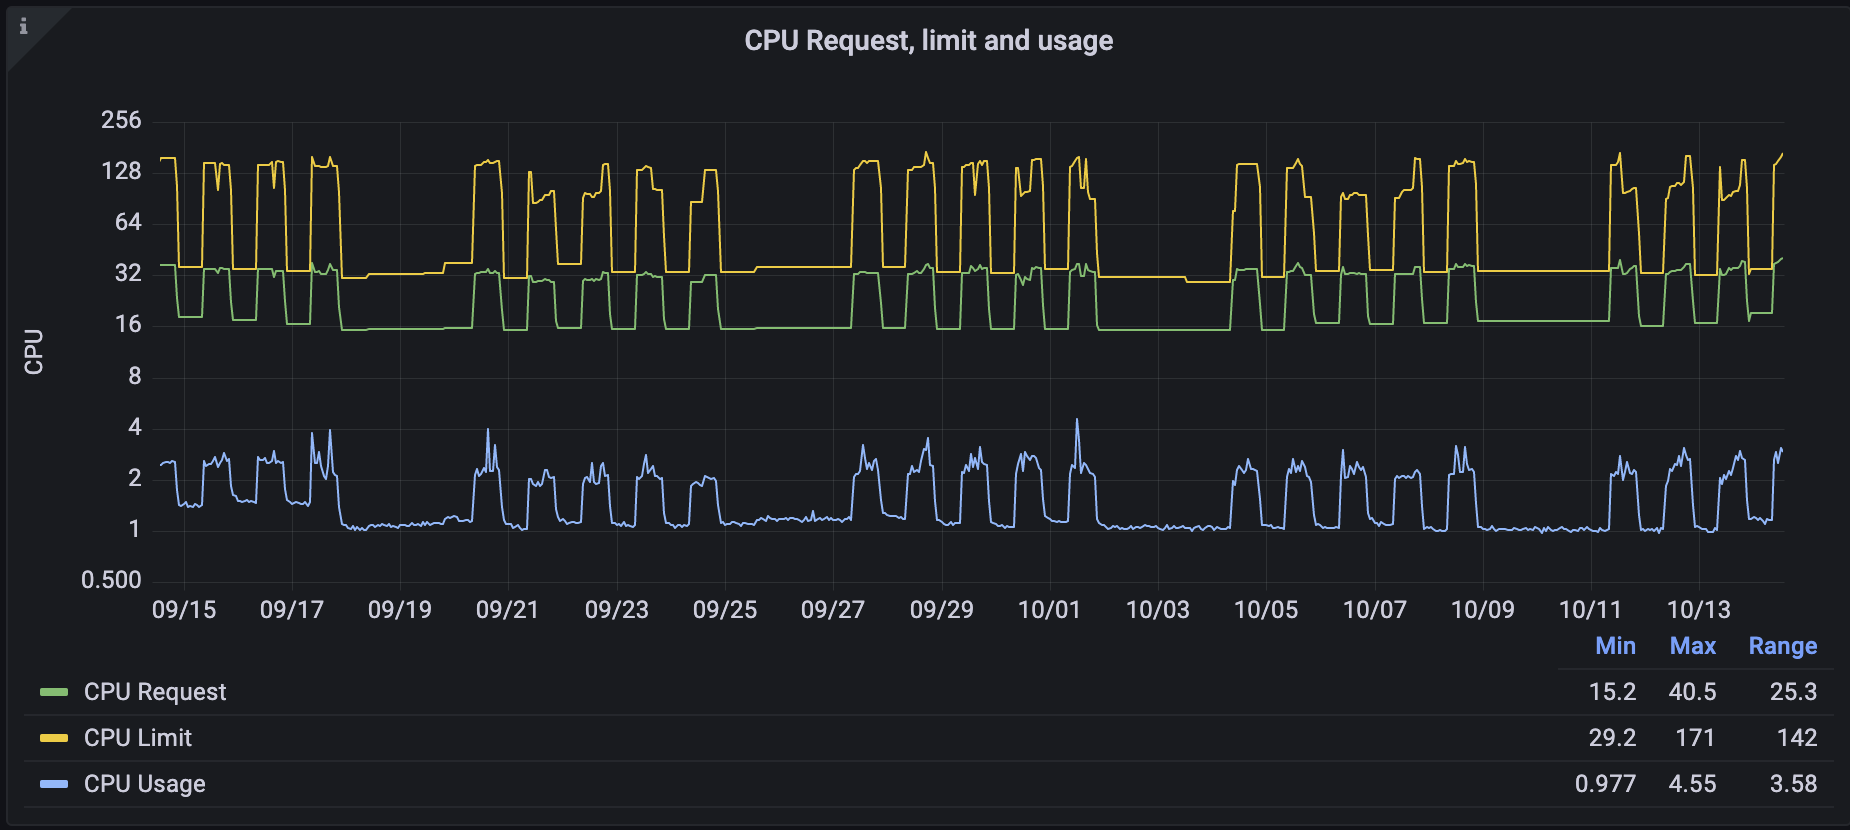
CPU Usage
It is possible to see the same pattern for CPU usage in the following image.
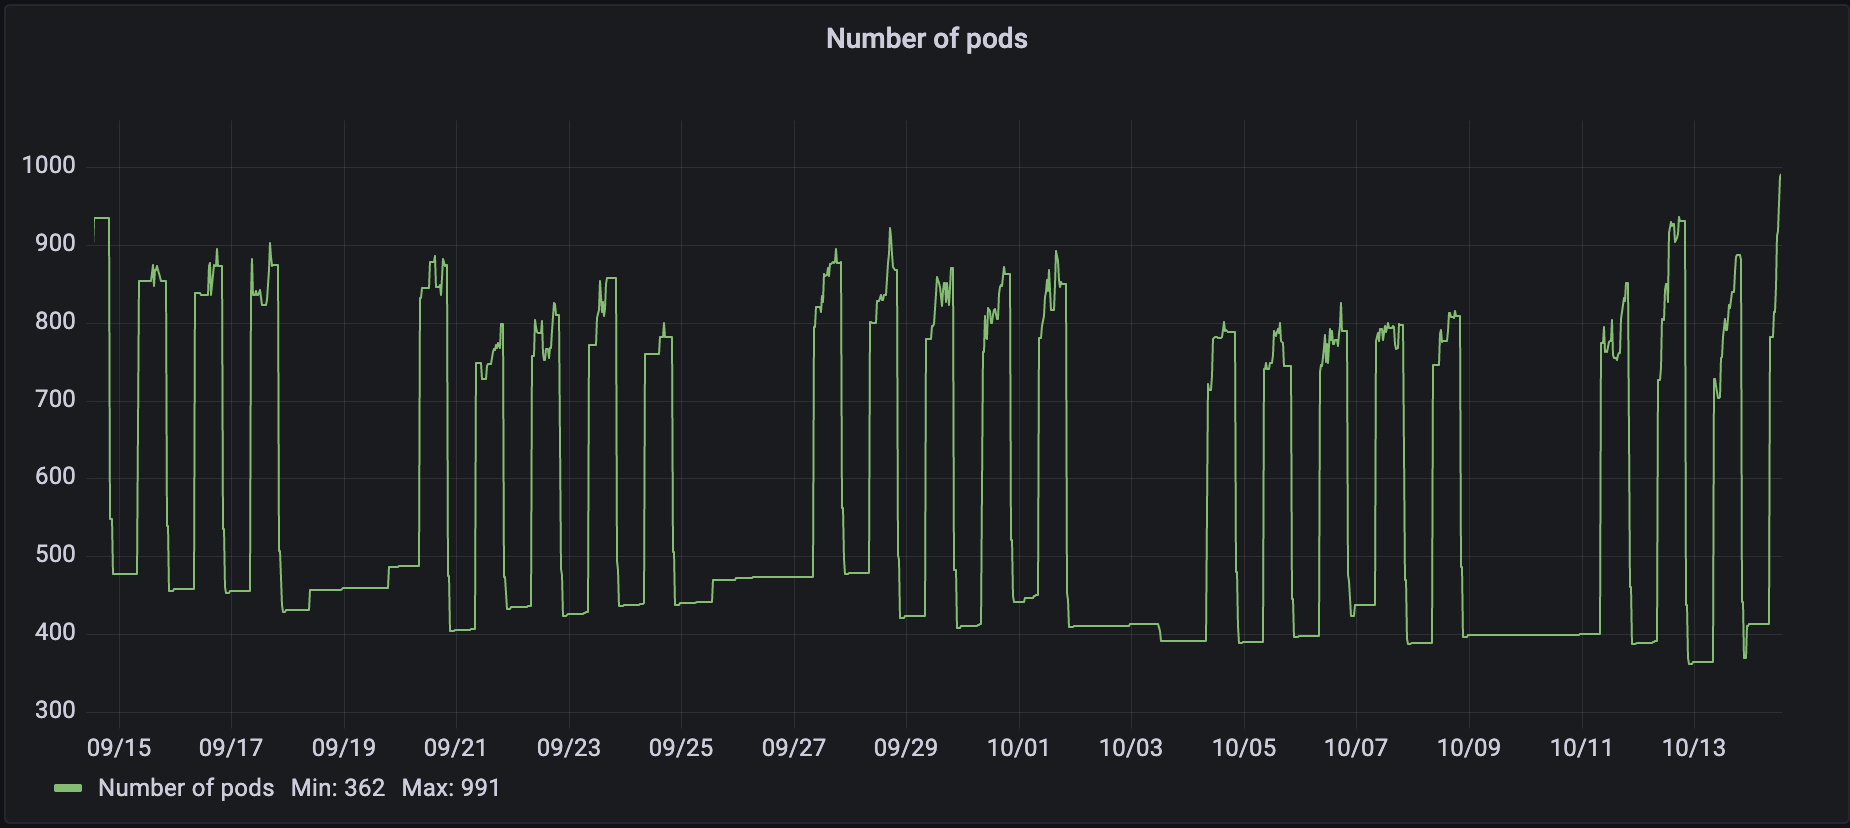
Pods
In this image, the changes in the number of pods in the cluster are shown.
Numeric Summary
In this table, a comparison between before and after the use of kube-green.
| Total | With kube-green | Difference | |
|---|---|---|---|
| Number of pods | 1050 | 450 | 600 |
| Memory consumed [Gb] | 54 | 21 | 33 |
| CPU consumed [cpu] | 4.5 | 1 | 3.5 |
| Memory allocated [Gb] | 75 | 30 | 45 |
| CPU allocated [cpu] | 40 | 15 | 25 |
| CO2eq/week [kg] | 222 | 139 | 83 |
As shown in the table, 83 Kg of CO2eq are saved per week for this cluster. So in a year (52 weeks), the CO2eq saved is -4316 Kg CO2eq.
Nodes
In this use case, the resources saved are enough to downscale the number of nodes.
The size of 1 node in this cluster is 2 cores of CPU and 8 Gb of memory.
In this image, it is possible to see how the number of nodes in the cluster changes over time, following the same pattern as resource consumption.
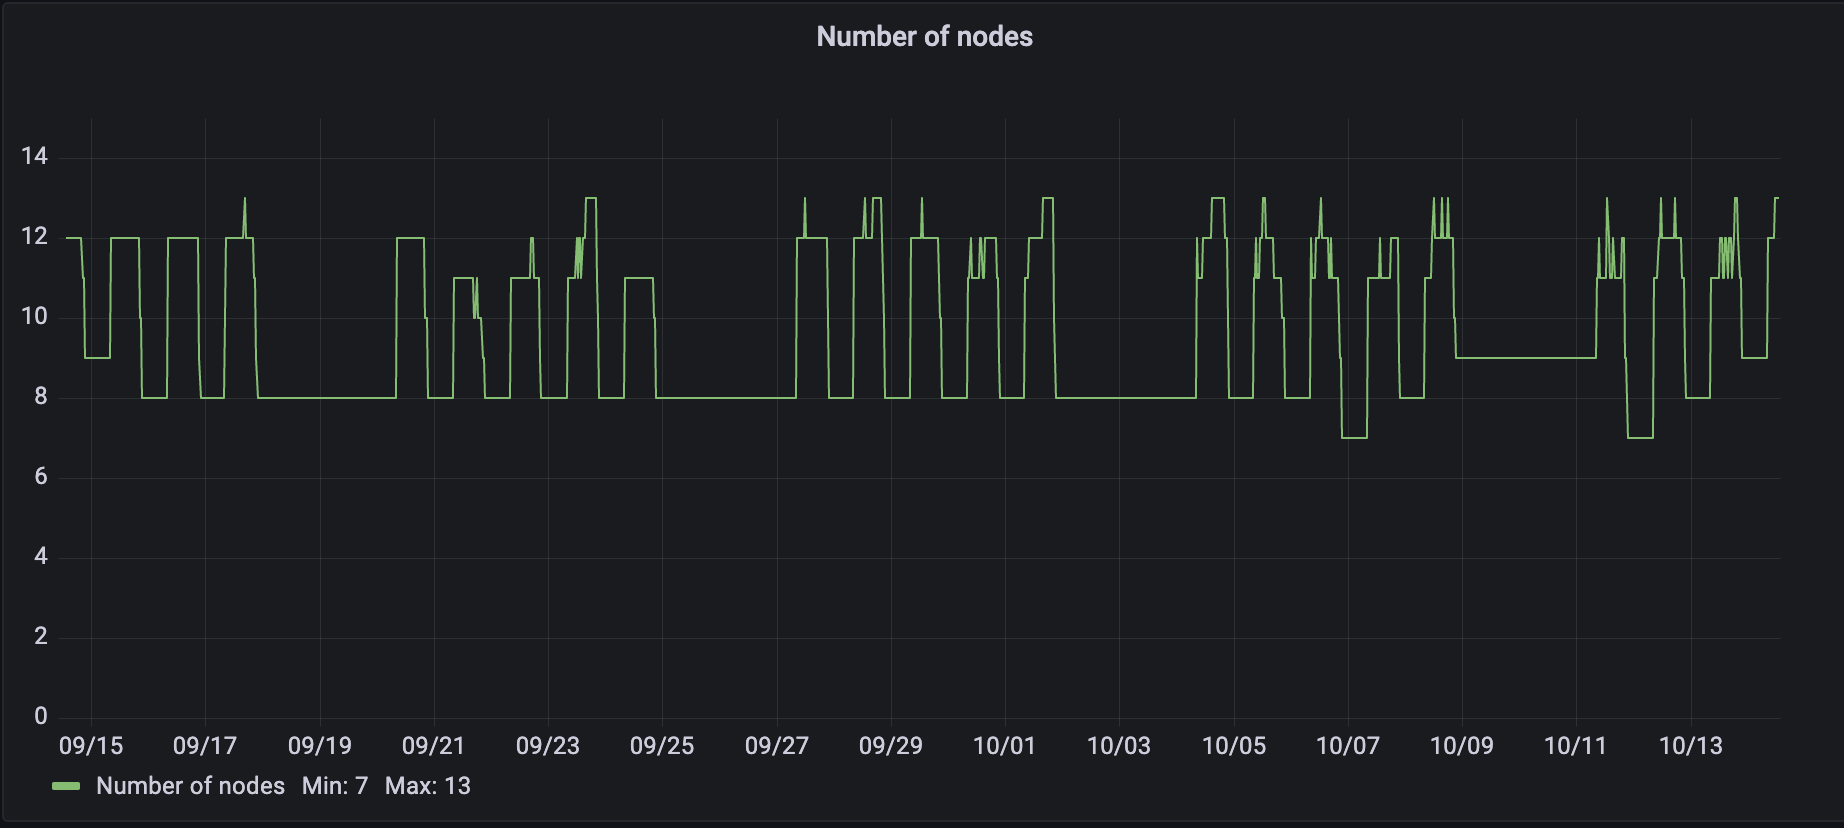
It is possible to see the decrease in the number of nodes from a maximum value of 13 to a minimum of 7. In most cases, the values are between 12 and 8 nodes, so 4 nodes are stopped every night and every weekend.
This could lead to a reduction not only in CO2 production but also in the cost of the cluster because, with cloud providers, the cluster is usually paid for based on the number of nodes.
Conclusion
In this use case, it is possible to see how much kube-green can save in CO2eq production and also in the cost of a cluster.
Try it out on your cluster, and calculate how much CO2 you can save with this tool!